
(The report content provides research opinions on specific issues for reference only and should not be interpreted as the policy of the Taiwan Stock Exchange.)
1. Introduction
As one of the world’s leading economies in terms of GDP, Japan’s capital market ranks among the largest globally. According to statistics from the World Federation of Exchanges (WFE), as of January 2026, the total market capitalization of listed companies on the Japan Exchange Group (JPX) exceeded USD 7 trillion, ranking 4th worldwide. The total trading value for the full year of 2025 surpassed USD 8 trillion, ranking 6th globally, underscoring its significant role in the global capital markets.
In December 2024, Taiwan’s Financial Supervisory Commission (FSC) announced that Japan is recognized as a jurisdiction for the registration of offshore exchange-traded funds (ETFs) and the domicile of their management institutions. As a result, Japanese ETFs are permitted to be cross-listed in Taiwan. By the end of 2025, one Japanese ETF had been listed in Taiwan, while two Taiwanese ETFs had been listed in Japan, reflecting significant progress in Taiwan–Japan cross-border collaboration. Investors in both markets can gain access to financial products in different markets through cross-border ETFs.
This article aims to compile information on the overview of listed products, the industry composition of listed companies, and the categories of listed products on the Tokyo Stock Exchange (TSE). Through a comprehensive review of the composition and trading profile of listed securities on the TSE, it seeks to provide a reference for identifying future directions of Taiwan–Japan cooperation.
2. Overview of Japan’s Capital Market
There are four securities exchanges in Japan: the Tokyo Stock Exchange (TSE), Sapporo Securities Exchange, Nagoya Stock Exchange, and Fukuoka Stock Exchange. Among them, TSE is the primary securities market, with a total of 3,940 domestic listed companies as of the end of 2025. TSE is a member of the Japan Exchange Group (JPX), whose other members include the Osaka Exchange (OSE), JPX Market Innovation & Research, Inc., and the Japan Securities Clearing Corporation (JSCC). The Osaka Exchange primarily handles trading in derivatives. This article mainly introduces TSE, which is primarily a cash market–focused exchange.
The TSE offers a diverse range of listed products, including equities and various types of funds. In terms of the number of listed instruments, domestic stocks constitute the largest category, followed by Exchange Traded Funds (ETFs) and real estate investment trusts (REITs). In terms of trading value, equities account for over 90% of the total trading value of equities, ETFs, ETNs, and REITs.
TSE’s equity markets comprise Prime Market, Standard Market, Growth Market, and TOKYO PRO Market. TOKYO PRO Market was established under the “Professional Investor Market System” introduced through the 2008 amendment to the Financial Instruments and Exchange Act. This market is not fully open to all investors. Trading on the buy side is limited to professional investors. In addition to institutional investors such as financial institutions and listed companies, certain qualified individuals who meet specific requirements are also eligible to participate.
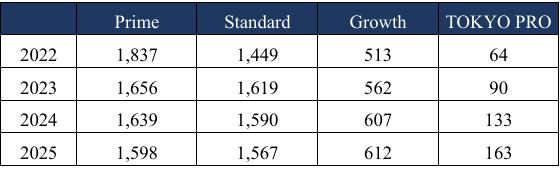
In terms of the number of domestic listed companies, Prime Market and Standard Market have a similar number of listings, while Growth Market and TOKYO PRO Market have fewer. In terms of market capitalization, domestic listed stocks are predominantly concentrated in Prime Market, which accounted for approximately 96.5% as of the end of 2025, followed by the Standard Market at approximately 2.7%.
3. Trading Value and Shareholding Ratios by Investor Type
Trading Value by Investor Type
TSE publishes monthly trading value data by investor type for listed equities on Prime, Standard, and Growth Markets, domestic ETFs, and REITs. Trading on TSE is categorized into two types: members’ account and customer’s account.
“Members’ account” refers to transactions conducted by institutions such as securities companies and banks using their own accounts.
“Customers’ account” refers to transactions executed by securities companies on behalf of their clients.
Customers’ account is further classified by investor type into corporations, securities companies, individuals, and foreigners. “Securities companies” refers to orders placed by other securities firms.
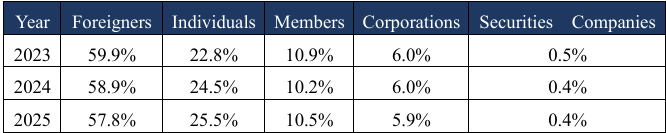
Based on TSE’s monthly trading value statistics, aggregating trading values for the three main equity markets (Prime, Standard, and Growth), as well as domestic ETFs and REITs, the proportion of trading value by investor type is calculated based on this combined total. Among the five major categories—members’ account, and customers’ account by corporations, securities companies, individuals, and foreigners—foreigners account for the largest share, representing approximately 57.8% of total trading value in 2025. This is followed by individuals at approximately 25.5%.
Over the past three years, the share of trading value from individuals has continued to increase, rising from 22.8% in 2023 to 25.5% in 2025. The combined share of members’ account, corporations, and securities companies accounts for approximately 16.7%.
For corporations, TSE further classifies trading value by different types of institutions, including investment trusts, business corporations, other institutions, and financial institutions. Among these, financial institutions account for the largest share, at approximately 2.5% of the total. Financial institutions include life & non-life, city banks and regional banks, trust banks, and other financial institutions.
Overall, overseas and individual investors account for the majority of trading value in Japanese equities, ETFs, and REITs, while domestic corporations account for a relatively smaller share.
Shareholding Ratio by Investor Type (Market Value Basis)
Japan Exchange Group (JPX) publishes the Share ownership Survey each July for the previous year. This survey is jointly conducted by TSE, Nagoya Stock Exchange, Fukuoka Stock Exchange, and Sapporo Securities Exchange, and covers domestic companies listed on these four exchanges.
The investor categories in the survey include: government and local government, financial institutions, securities companies, business corporations, foreigners, and individuals. Financial institutions are further classified into city banks and regional banks, trust banks, life insurance companies, non-life insurance companies, and other financial institutions.
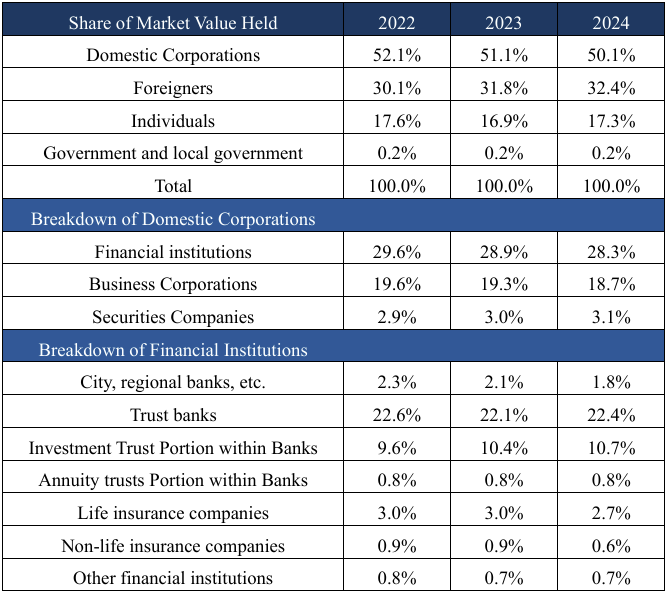
While foreigners account for the largest share of trading value, in terms of the market value of holdings, against the backdrop of cross-shareholding among Japanese companies, domestic corporations (including financial institutions, securities companies, and business corporations) hold a relatively higher proportion. In 2024, domestic corporations accounted for approximately 50.1% of the total market value of holdings, with financial institutions and business corporations representing about 28.3% and 18.7%, respectively. Foreigners accounted for approximately 32.4%, while individuals held about 17.3%.
Among financial institutions, trust banks are the primary holders of listed shares, accounting for 22.4% of total market value of holdings. Within trust banks and city/regional banks, the portion attributable to investment trusts accounts for approximately 10.7%.
From 2022 to 2024, the shareholding ratio of foreigners increased year by year. Meanwhile, amid the TSE’s ongoing promotion of corporate governance reforms and its efforts to encourage listed companies to reassess policy shareholdings, the shareholding ratios of financial institutions and business corporations have gradually declined. Except for investment trusts—whose share has increased—the proportion of listed shares held by most financial institutions has decreased.
4. Overview of Industries of Listed Companies in Japan
Number of Companies and Market Capitalization Distribution by Industry
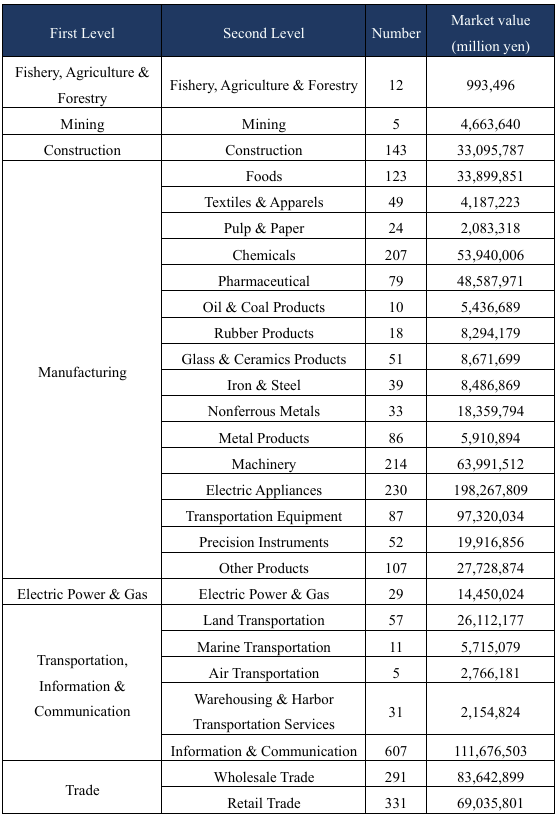
Companies listed on Japanese securities exchanges are all classified into industries based on a unified standard. The industry classification consists of two levels. At the first level, there are 10 industry categories, covering manufacturing as well as non-manufacturing sectors such as transportation, information & communication. Among companies listed on the three main markets of TSE (Prime, Standard, and Growth), manufacturing companies account for approximately 37.3% of the total number of listed companies, while non-manufacturing companies (including financials) account for about 62.7%. In terms of market capitalization, manufacturing represents approximately 50.7%, while non-manufacturing (including financials) accounts for about 49.3%.
The second level provides a more detailed classification, consisting of 33 industry categories. The manufacturing sector is further subdivided into 16 industries, including Electric Appliances, Transportation Equipment, and Precision Instruments. Among the 33 industry categories, the largest number of listed companies on the three main TSE markets falls under “Information & Communication.” According to the Japan Standard Industrial Classification, the Information & Communication sector (情報通信業) includes telecommunications, media, information services, and publishing. The second and third largest industries by number of listed companies are “Services” and “Retail Trade,” respectively. These three industries are all non-manufacturing sectors and together account for nearly 40% of the total number of listed companies across the three markets.
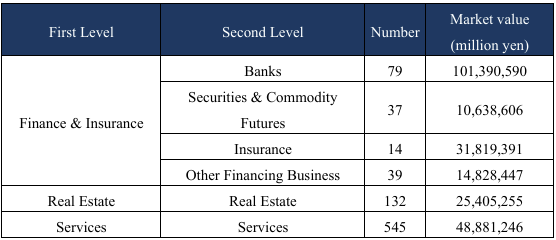
In terms of market capitalization of listed companies, the top three industries are “Electric Appliances,” “Information & Communication,” and “Banks.” Together, these three industries account for approximately 30% of the total market capitalization of listed companies across the three markets.
In comparison with TWSE market, in Taiwan, the electronics sector accounts for approximately 40% of the total number of listed companies, while representing around 70% of total market capitalization. The top three industries by number of listed companies are Electronic Parts & Components, Semiconductors, and Optoelectronic, all of which belong to the electronics sector. The top three industries by market capitalization are Semiconductor, Electronic Parts & Components, and Finance & Insurance.
Overall, in Japan’s capital market, the development of manufacturing and non-manufacturing sectors is relatively balanced. In terms of the number of companies, non-manufacturing (including financials) accounts for a larger share, with “Information & Communication” being the largest industry by number of listed companies. In terms of market capitalization, manufacturing and non-manufacturing are roughly comparable, with manufacturing slightly higher, and “Electric Appliances” being the largest industry. On the other hand, Taiwan’s market is characterized by the strong development of the electronics industry, where “Electronic Parts & Components” has the largest number of listed companies, and the Semiconductor industry accounts for the largest share of market capitalization.
Revenue and Profit Overview for Fiscal Year 2024
JPX publishes annually in July an overview of the revenue and profit performance of companies listed on the Prime, Standard, and Growth markets for the previous fiscal year, with breakdowns by industry.
In terms of revenue, in 2024 manufacturing and non-manufacturing (including financials) accounted for 47.4% and 52.6%, respectively. Among the 33 industry categories, the top five industries by revenue over the past five years (2020–2024) include two manufacturing industries and three non-manufacturing industries: “Transportation Equipment,” “Wholesale Trade,” “Electric Appliances,” “Retail Trade,” and “Information & Communication.” From 2020 to 2022, “Wholesale Trade” ranked first in revenue, while from 2023 onward, “Transportation Equipment” became the leading industry in terms of revenue.
In terms of profits, in 2024 manufacturing and non-manufacturing (including financials) accounted for 43.8% and 56.2%, respectively. The top five industries by profit over the past five years mainly consist of two manufacturing industries and three non-manufacturing industries: “Transportation Equipment,” “Electric Appliances,” “Banks,” “Wholesale Trade,” and “Information & Communication.” In addition, in 2021, “Chemicals” temporarily replaced “Information & Communication” as the fifth most profitable industry.
The net profit margin for each industry in Japan is calculated in this report by dividing total profits by total revenue for each industry. For industries with relatively high revenue or profit, the 2024 net profit margins are as follows: Transportation Equipment 5.1%, Wholesale Trade 4.2%, Electric Appliances 6.9%, Retail Trade 2.9%, Information & Communication 9.0%, and Banks 12.8%. The bank industry has consistently maintained a net profit margin above approximately 10%, while the Information & Communication industry recorded a relatively lower margin in 2021 but has shown continuous growth in recent years.
Shareholding Overview by Industry for Listed Companies
According to the Share ownership Survey published by JPX in July 2025, among domestic companies listed on the Tokyo, Nagoya, Fukuoka, and Sapporo securities exchanges in 2024, domestic corporations held the largest share of market capitalization, followed by foreigners, and then individuals. Within domestic corporations, the main holders are Trust Banks and Business Corporations.
The survey provides data on share of market value held by investor category across industries, defined as the proportion of the market value of shares held by a specific investor category in a given industry relative to the total market capitalization of that industry. The following outlines the 2024 shareholding structure of Japanese listed companies by foreigners, trust banks, individuals, and business corporations based on share of market value held.
In 2024, foreigners held approximately 32.4% of the total market capitalization of Japanese listed companies. At the industry level, compared with other investor categories, foreign investors had higher share of market value held in Pharmaceuticals (46.3%), Precision Instruments (45.7%), Electric Appliances (44.2%), and Other Products (41.5%). This indicates that foreigners in Japan’s capital market tend to allocate assets toward pharmaceuticals and electronics-related sectors.
For trust banks, the share of market value held across industries in 2024 were all around 20% (ranging from 17.4% to 28.2%), close to their overall share of market value held of 22.4%. In contrast, foreign investors’ share of market value held across industries ranged more widely, from 14.8% to 46.3%, reflecting that trust banks’ investment allocations across industries more closely mirror the overall market capitalization distribution. Industries with relatively higher share of market value held by trust banks include Precision Instruments (28.2%), Electric Appliances (26.1%), and Insurance (26.0%).
For individuals, the overall share of market value held in 2024 was approximately 17.3%. Unlike foreigners and trust banks, individuals had relatively lower share of market value held in Precision Instruments and Electric Appliances, at only 10.4% and 11.6%, respectively, compared to the overall share of market value held. Industries with higher share of market value held by individuals include Air Transportation (47.7%) and Fishery, Agriculture & Forestry (29.6%).
For business corporations, the overall share of market value held in 2024 was approximately 18.7%. Industries with higher share of market value held include Transportation Equipment (33.2%), Pulp & Paper (31.4%), Information & Communication (31.2%), and Warehousing & Harbor Transportation Services (27.0%).
Overall, trust banks’ holdings across industries more closely align with the overall distribution of market capitalization. Foreigners tend to have higher share of market value held in Pharmaceutical and Precision Instruments; individuals in Air Transportation and Fishery, Agriculture & Forestry; and business corporations in industries such as Transportation Equipment.
5. Overview of Listed ETFs
According to the ETF, Leveraged and Inverse Products List published by Japan Exchange Group (JPX), as of March 21, 2026, a total of 419 ETFs are listed, covering equity ETFs, bond ETFs, commodity ETFs, as well as leveraged and inverse ETFs.
ETFs listed on the TSE are predominantly equity ETFs. There are 135 Japan equity ETFs, which are further classified by the type of underlying index into market-based ETFs (such as those tracking TOPIX, Nikkei 225, Prime Market, and Growth Market indices), size-based ETFs, sector-based ETFs (including sectors such as Precision Instruments and Pharmaceuticals), and thematic indices. In addition, there are 101 foreign equity ETFs, tracking indices such as the S&P 500, NASDAQ-100, Dow Jones Industrial Average, and SSE 50 Index.
For bond ETFs, foreign bonds constitute the majority, with underlying indices including the S&P U.S. Treasury Bond 7-10 Year Index and the FTSE World Government Bond Index.
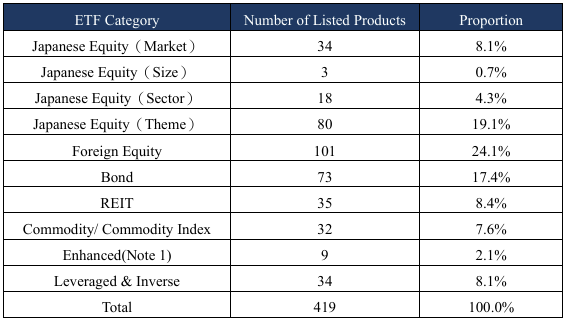
Note 1: refers to ETFs that employ options or other investment strategies.
Net Assets of ETFs by Category
JPX publishes annually in July ETF Beneficiary Survey. The survey covers ETFs listed on Japanese securities exchanges (Tokyo, Nagoya, Fukuoka, and Sapporo), including foreign ETFs listed in Japan in the form of JDRs and actively managed ETFs.
The report classifies ETF beneficiaries by investor category, including financial institutions. It also discloses net assets by ETF category, as well as net assets held by each investor category. Beneficiary information is based on the beneficiary register maintained by the ETF’s trustee (trust banks).
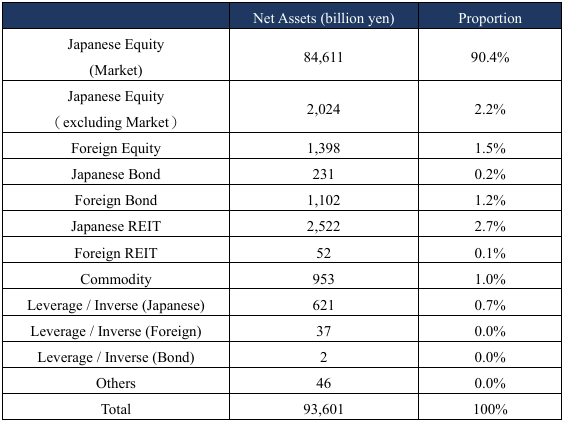
As of July 2025, total net assets of ETFs listed in Japan reached JPY 93.6 trillion. Among all categories, Japan equity ETFs (market) accounted for the largest share, with net assets of JPY 84.6 trillion, representing approximately 90.4% of total listed ETF net assets. This was followed by Japan REITs (refers to ETFs that invest in Japanese REITs.), and then other categories of Japan equity ETFs.
Overview of ETF and ETN Holdings by Beneficiaries
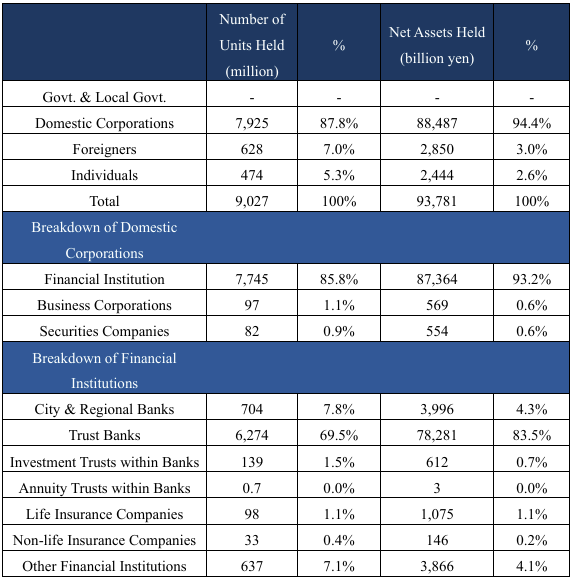
According to the ETF Beneficiary Survey published by JPX in July 2025, ETFs and ETNs in Japan are primarily held by trust banks within Japanese financial institutions. Their share of holdings accounts for 69.5% in terms of units and 83.5% in terms of net assets.
In terms of net assets share, the ranking from highest to lowest after trust banks is as follows: city banks & regional banks (4.3%), foreigners (3.0%), and individuals (2.6%).
Different types of investors exhibit varying allocation preferences across ETF categories. However, Japan equity ETFs (market) remain the primary ETF holdings for all investor categories. Among the ETFs held by each investor group, the proportion invested in Japan equity ETFs (market) is 98.4% for trust banks, 41.6% for city banks & regional banks, and 59.1% for foreigners.
In addition, city banks & regional banks allocate not only to Japan equity ETFs but also to J-REIT ETFs, with approximately 30% of their ETF investments placed in the latter.
For individuals, compared to other investor categories, the proportion invested in Japan equity ETFs is relatively lower, at only 21.1%. Higher allocation proportions are observed in foreign equity ETFs (25.4%) and Japan leveraged and inverse ETFs (15.0%), reflecting that individuals in Japan also use ETFs to invest in financial products beyond domestic equities.
6. Advantages and Strategic Directions for Taiwan–Japan Capital Market Cooperation
Taiwan’s Electronics Industry Is Competitive, and Listing Related Products in Japan Could Provide Electronics-themed Investment Products.
The net profit margin of Taiwan’s semiconductor sector is relatively high. According to Financial Info of Listed Companies Quarterly, the overall net profit margin of Taiwan’s semiconductor industry exceeds 25%, and has remained above 20% from 2020 to 2024. Even excluding TSMC, the net profit margin of Taiwan’s semiconductor industry still exceeded 10% in 2024, highlighting its unique position.
Overall, Taiwan possesses a highly developed electronics industry and maintains stable advantages in specific sectors. Future product cooperation between Taiwan and Japan could provide Japanese investors with access to Taiwan’s industry value chains, which are globally competitive.
Deepening Taiwan-Japan Cooperation in the ETF Market. Supporting Taiwanese Investors in Gaining exposure to a Diverse Range of Industries.
Japan’s listed companies span a wide range of industries, with a balanced distribution of market capitalization between manufacturing and non-manufacturing sectors. In manufacturing, Japan has large-scale industries such as Electric Appliances and Transportation Equipment. In non-manufacturing, key sectors include Information & Communication, Wholesale Trade, Retail Trade, and Banks.
Building on this well-balanced and diversified industrial structure, Japan offers ETFs that track a wide range of industries, including food, retail, electric appliances, and logistics. Through cross-border listed feeder ETFs in Taiwan that track Japanese markets, Taiwanese investors can gain exposure to information on financial products covering diverse industries.
Enhancing Promotion Efforts. Strengthening Japanese Investors’ Understanding of the Taiwan Market.
In Japan’s ETF market, beneficiaries are highly concentrated in trust banks, which account for approximately 83.5% of ETF net assets. Furthermore, 98.4% of the ETFs held by trust banks are Japan equity ETFs (market).
Taiwan’s ETFs listed in Japan in the form of feeder ETFs are classified as foreign equity ETFs. In 2025, the primary beneficiaries of foreign equity ETFs were “individuals,” accounting for 44.5%. Although the scale of ETF holdings by Japanese individuals has grown steadily in recent years, holdings of individuals in industries such as Electric Appliances and Precision Instruments represent a smaller proportion of their total equity holdings compared to trust banks and foreign investors. Their share of market value held in these industries are also lower than their share of market value held in the whole market.
Looking ahead, as Taiwan–Japan product cooperation continues to progress, efforts could focus on strengthening Japanese investors’ understanding of Taiwan’s semiconductor sector, deepening Japanese investors’ familiarity with Taiwan’s capital market.